Briefing in preparation for a day when the weather turns good. I was feeling about 90% myself, having just recovered from a cold, mentally all with it, but looking back it’s probably a good thing the cloud base was low.
One of those, write it down and maybe some of it will sink in (might even be right) posts and it may even be useful or interesting to someone else, you never know 🙂
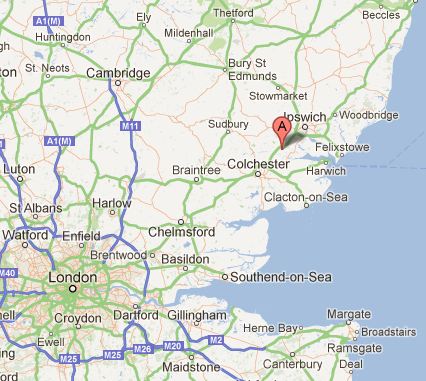
Trip to East Bergholt
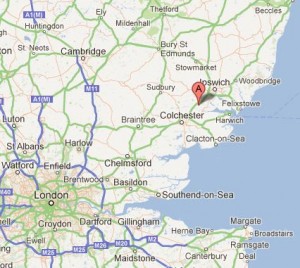
East Bergholt (Location)
This is the standard “Dual Nav #1” destination and at this stage I’m happy to fly almost anywhere, so no I’ve never heard of the place either, but that doesn’t matter – it’s just somewhere to go (no doubt picked for a variety of good reasons – possibly because the locals haven’t got sick of Cessna’s doing 180’s over their village yet).
To plan the trip we’ll be needing the following toys (and a pen):
- Flight Computer
- Square Protractor
- Ruler (scale markings in Nautical Miles, 1:500,000)
- A current aeronautical map
- Some paper (preferably with relevant columns and such like for flight planning).
If you need sticky back plastic, something has probably gone wrong…..
Magnetic Variation
Is the angle / difference, from magnetic north to true north, aviation maps are based on Truth North but once in the plane everything (Direction Indicator) is setup with reference to a compass which will measure magnetic north (ignoring some other errors which are calibrated out and we won’t go into).
If your variation is West, add it……if it’s East, subtract it. Giving to the slightly politically incorrect phrase
West is Best……East is Least
It could be a big number, but for around these parts it’s variation comes out at roughly +1 to the true heading
So when we’ve compensated for wind etc. our final heading needs to be adjusted by +1.
A useful website if you want to know your magnetic variation.
Safety Altitude
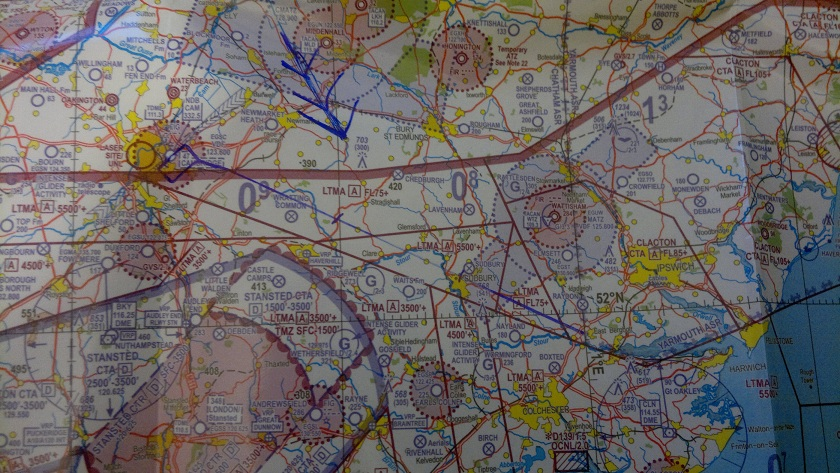
Map Marked for East Bergholt
This potentially will impact the wind velocities we need to input – we know where we’re going so we can figure out the safety altitude, then we can think about a flight altitude for the trip and finally that will let us think about the wind velocities.
There are generally two ways to determine a minimum safety altitude.
Option 1: Plot the route as per something like the picture on the right, then taking 5 miles either side of the route, find the highest obstacle – but be weary some items do not need to appear on the map (e.g. a mast that is 299ft), which means a mast on top of a hill could catch you out.
Option 2: You’ll see on the map (chart), some elevation markings “09”, “08” etc. in purple, take the biggest number your route crosses and add 500ft. This is the absolute minimum safety height.
Our route crosses 900ft, so our absolute minimum is 1,400ft.
Flight Altitude
Above 1,400ft but we can’t fly in cloud and we might also get restricted by airspace.
On this particular route, anything above 5500ft and we’ll be heading into Class A airspace, we can’t do that. So something below 5,500 and above 1,400ft.
What about the clouds, well I’m rarely lucky enough to get a cloud base above 4,000ft, so something below that. How about we aim for a nice round 2,000ft.
The Wind
Whatever it happens to be on the day – but we actually care about what the wind is doing at our intended flight altitude for the trip, not the surface wind. You can find this quite easily thanks to the Met Office and Form 214 (UK Spot wind chart). For the purpose of walking this through let’s say 330 degrees, 15 knots (330/15).
Track
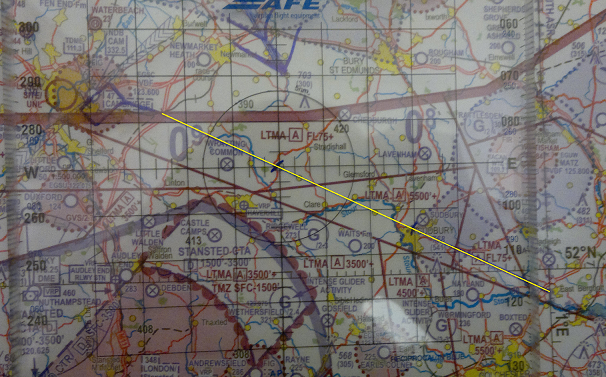
If there was no wind and no magnetic errors, this is the direction we’d want to fly – we’re never that lucky, but to work out the rest you need a reference. So using our map and a square protractor we can figure out which way we’d point the plane in an ideal world – just to highlight the route, I’ve emphasized it in yellow.
Protractor Overlay
The picture doesn’t do it justice, but trust me it’s about 115 degrees (True).
Distance
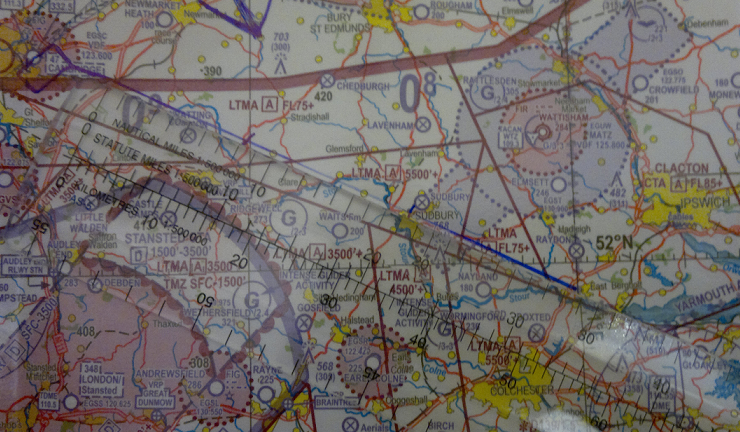
East Bergholt – Distance Measurement
Hopefully you’ve noticed that we’ve marked up the route on the map (we know where we are, we know where we want to go and give or take, there’s nothing stopping us from going in a straight line to get there – the beauty of flight!)
What you might not have noticed is that the starting point is from a known reference point, a point by which we will hopefully have set our speed, be straight and level and not have much else to do but press “start” on the clock. In this case, it’s 6 mile bottom and as luck would have it, is about 6 miles from the airport.
Using the most expensive piece of plastic you may have ever bought, measuring the distance in nautical miles is a 10 second affair, place ruler on line, read off the distance (just be sure you’re using the correct scale!)
Give or take a little, we can call that 29 nautical miles (flying in knots remember).
Now all we need to do is figure out which way we should actually point the plane in order to reach our destination (i.e. do our best to avoid going randomly off course due to wind and magnetic variation).
Airspeed
Keep it simple a nice round cruise speed of 100 knots today.
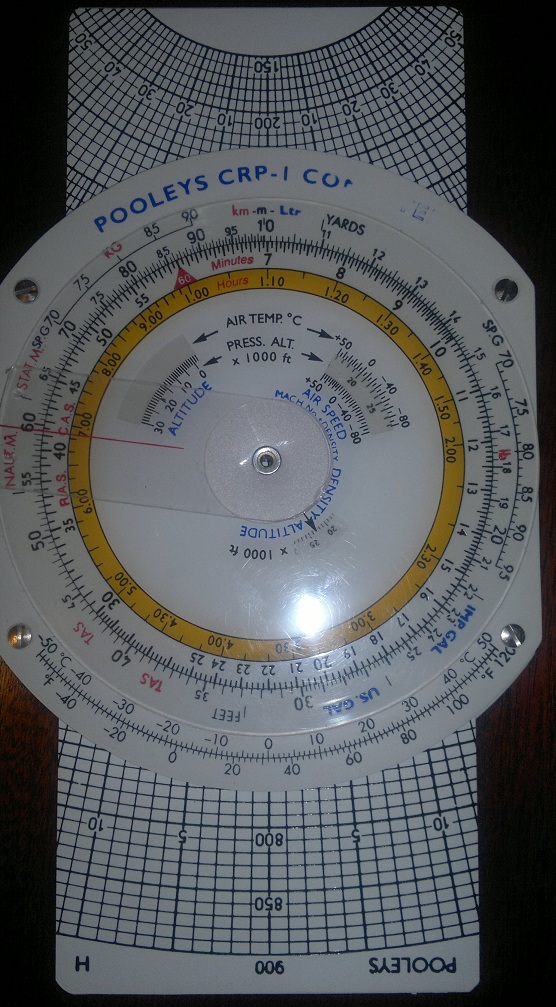
Flight Computer (CRP-1)
The Flight Computer
You can do this next bit with graph paper and a calculator, but it’ll take you longer and would be using the universal language of mathematics……to hell with that, we’re paying £3/min to be in this party, time to crack out the toy that make this flying business look complicated to the outside world 🙂
Firstly we know that if there was no wind and we could fly a true heading, we’d want to fly 115 degrees (see track). There is wind, 330/15, so we need to correct for this.
Using the “Wind Down” method on the flight computer:
- Flip it over to the “wind” side and set the little circular dot to the top of the ‘low speed wind’ chart.
- Turn the dial until “Index” is set against the wind direction (330)
- Now mark the wind speed, perpendicular to the circular dot (see picture), 15 knots today.
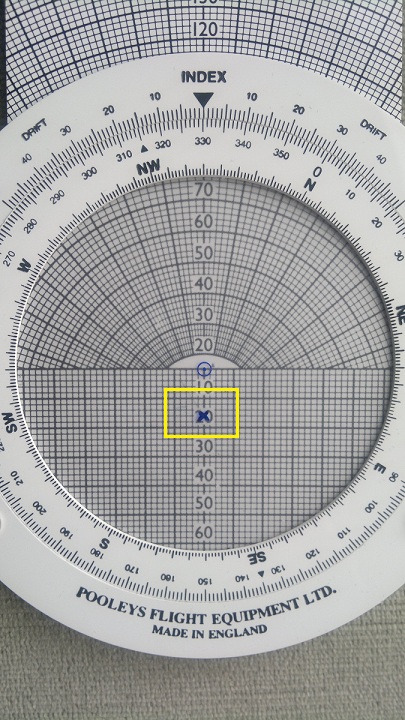
Wind Speed Marked
Heading Correction & Ground Speed
Now to find out what the heading correction needs to be:
- Slide the centre plastic part up until the circular dot is against our intended airspeed (100).
- Now turn the dial until it’s set to the Track (115)
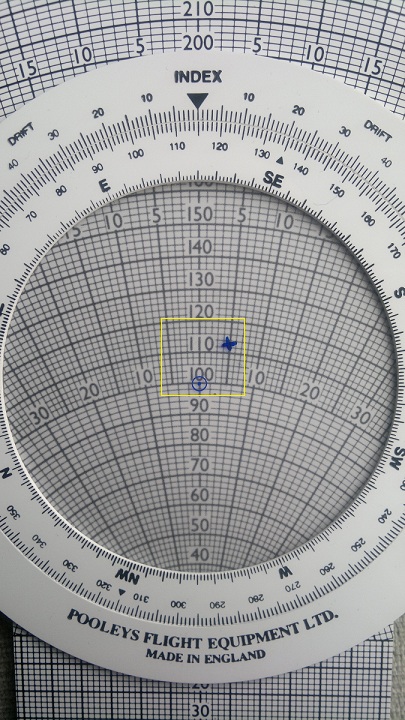
As you can see and might expect, the mark we made for the wind speed, has now moved out to the right, give or take 1 degree (largely hinges on how good your marker pen skills are), if you look down from the mark to the line reading “10, 20, 30…”), you’ll see the difference between the centre and where the mark crosses this line is about 5 degrees.
So we’re going to be pushed at an angle of 5 degrees to the right, therefore we fly a heading (True) of 110 degrees.
However, the flight computer has one other trick up its sleeve – when walking through the briefing, when asked how could I work out the groundspeed, my first thought was “I know the wind, I can therefore work out the headwind/tailwind component”. You could, but this involves a new set of tasks with the flight computer……..look again at the flight computer, you’ll notice that the marked cross is horizontally aligned with 112, that will be our ground speed if the wind stays constant.
So we now also know our ground speed will be 112 knots.
We know our ground speed (112 knots), we know our distance (29 nautical miles), thus we can work out how long the trip will take. Just flip the flight computer over.
Setting Ground Speed
The first thing to remember is that a flight computer is a circular slide rule. Therefore it’s up to you to remember where you put the decimal place (e.g. 10 can be, 1, 10, 100, 1000….) and as long as you keep track of where the decimal point is today you’ll be good……..the task of doing so however introduces risk of human error.
The steps are as follows:
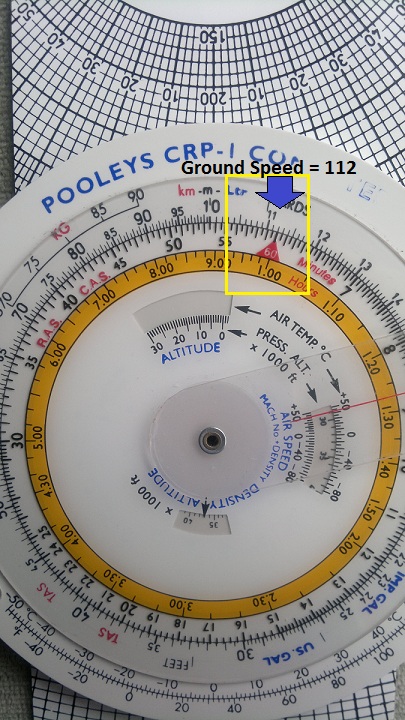
- Find the Index marker (Red Triangle marker in this case, marked “60”).
- Rotate the dial such that the point of this index is aligned against your previously calculated Ground Speed (112) on the outer maker.
Note what I said about a slide rule, in the photo on the right you might easily think I’ve just aligned it to “11.2”, but what is actually happening is I’m essentially shifting the decimal place out to the right by one place and thus it’s now “112”
All that’s left to do now is to find the distance we’re traveling and read off the time it’ll take to get there:
Time to Travel
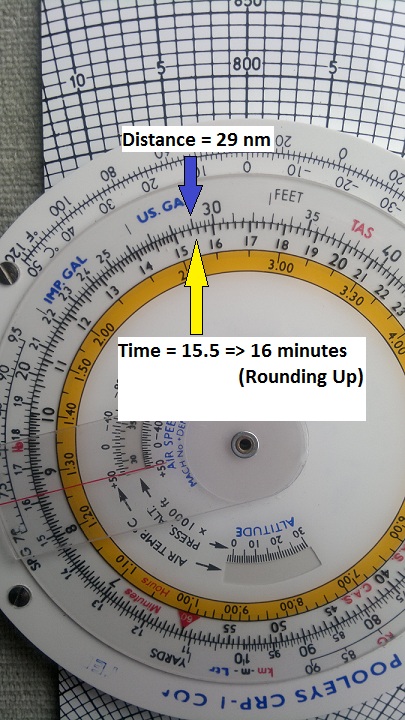
- Find the distance to travel on the outer scale (29 nautical miles in our case) – note that the outer scale changes its precision at some points (e.g. some points like 11->12 have 10 increments and others, 21->22 have only 5 increments), thus the precision of the answer you get will vary.
- Now read off the number from the inner scale, you’ll see in our example it reads around 15 minutes 30 seconds – you can round up. We’re going to break the flight up into shorter legs anyway, this just tells us within 30 seconds when we should be at our destination.
The process for measuring the distance on the map and then computing ETA’s can be repeated to break the trip up into shorter legs, thus ensuring that you don’t drift to far off track (at least that’s the general theory).
One final correction to Heading
It flowed better to go through the flight computer stuff in one hit, but waaaaay back at the top of this post I mentioned magnetic variance and about 6 paragraphs or so back I mentioned the flight computer had told us we wanted to fly 110 degrees True.
All good, but we need to compensate for that variance or we’ll have an error creeping in that will send us off track the further we fly.
The variance was 1 degree west, so we add this to the True heading (110) to get our final heading (magnetic) of 111 degrees.
And that is the theory……Verifying your Answer
Humans make random mistakes, the Flight Computer is very accurate, but lacks precision and prone to errors. Digital Machines however are very repeatable things, so a well tested digital tool is a good way to verify your own multi-step, manage your own decimal place, try not to get distracted human process 🙂
Enter SkyDemon Lite set where you are, where you want to go. Add your speed and the wind and you’re done!!!

SkyDemon PLOG
Our mechanical numbers agree to within 1 degree, that’s about as good as it’s going to get (and good luck flying +/-1 degree anyway), so I’ll take that. The time looks about right to, remember I rounded up to 16 minutes. Oh yeah and the level is wrong, just ran with their default, we were flying at 2,000 in my example but doesn’t matter for our example as we’ve set the wind the same.